“A house divided against itself cannot stand.” — Abraham Lincoln
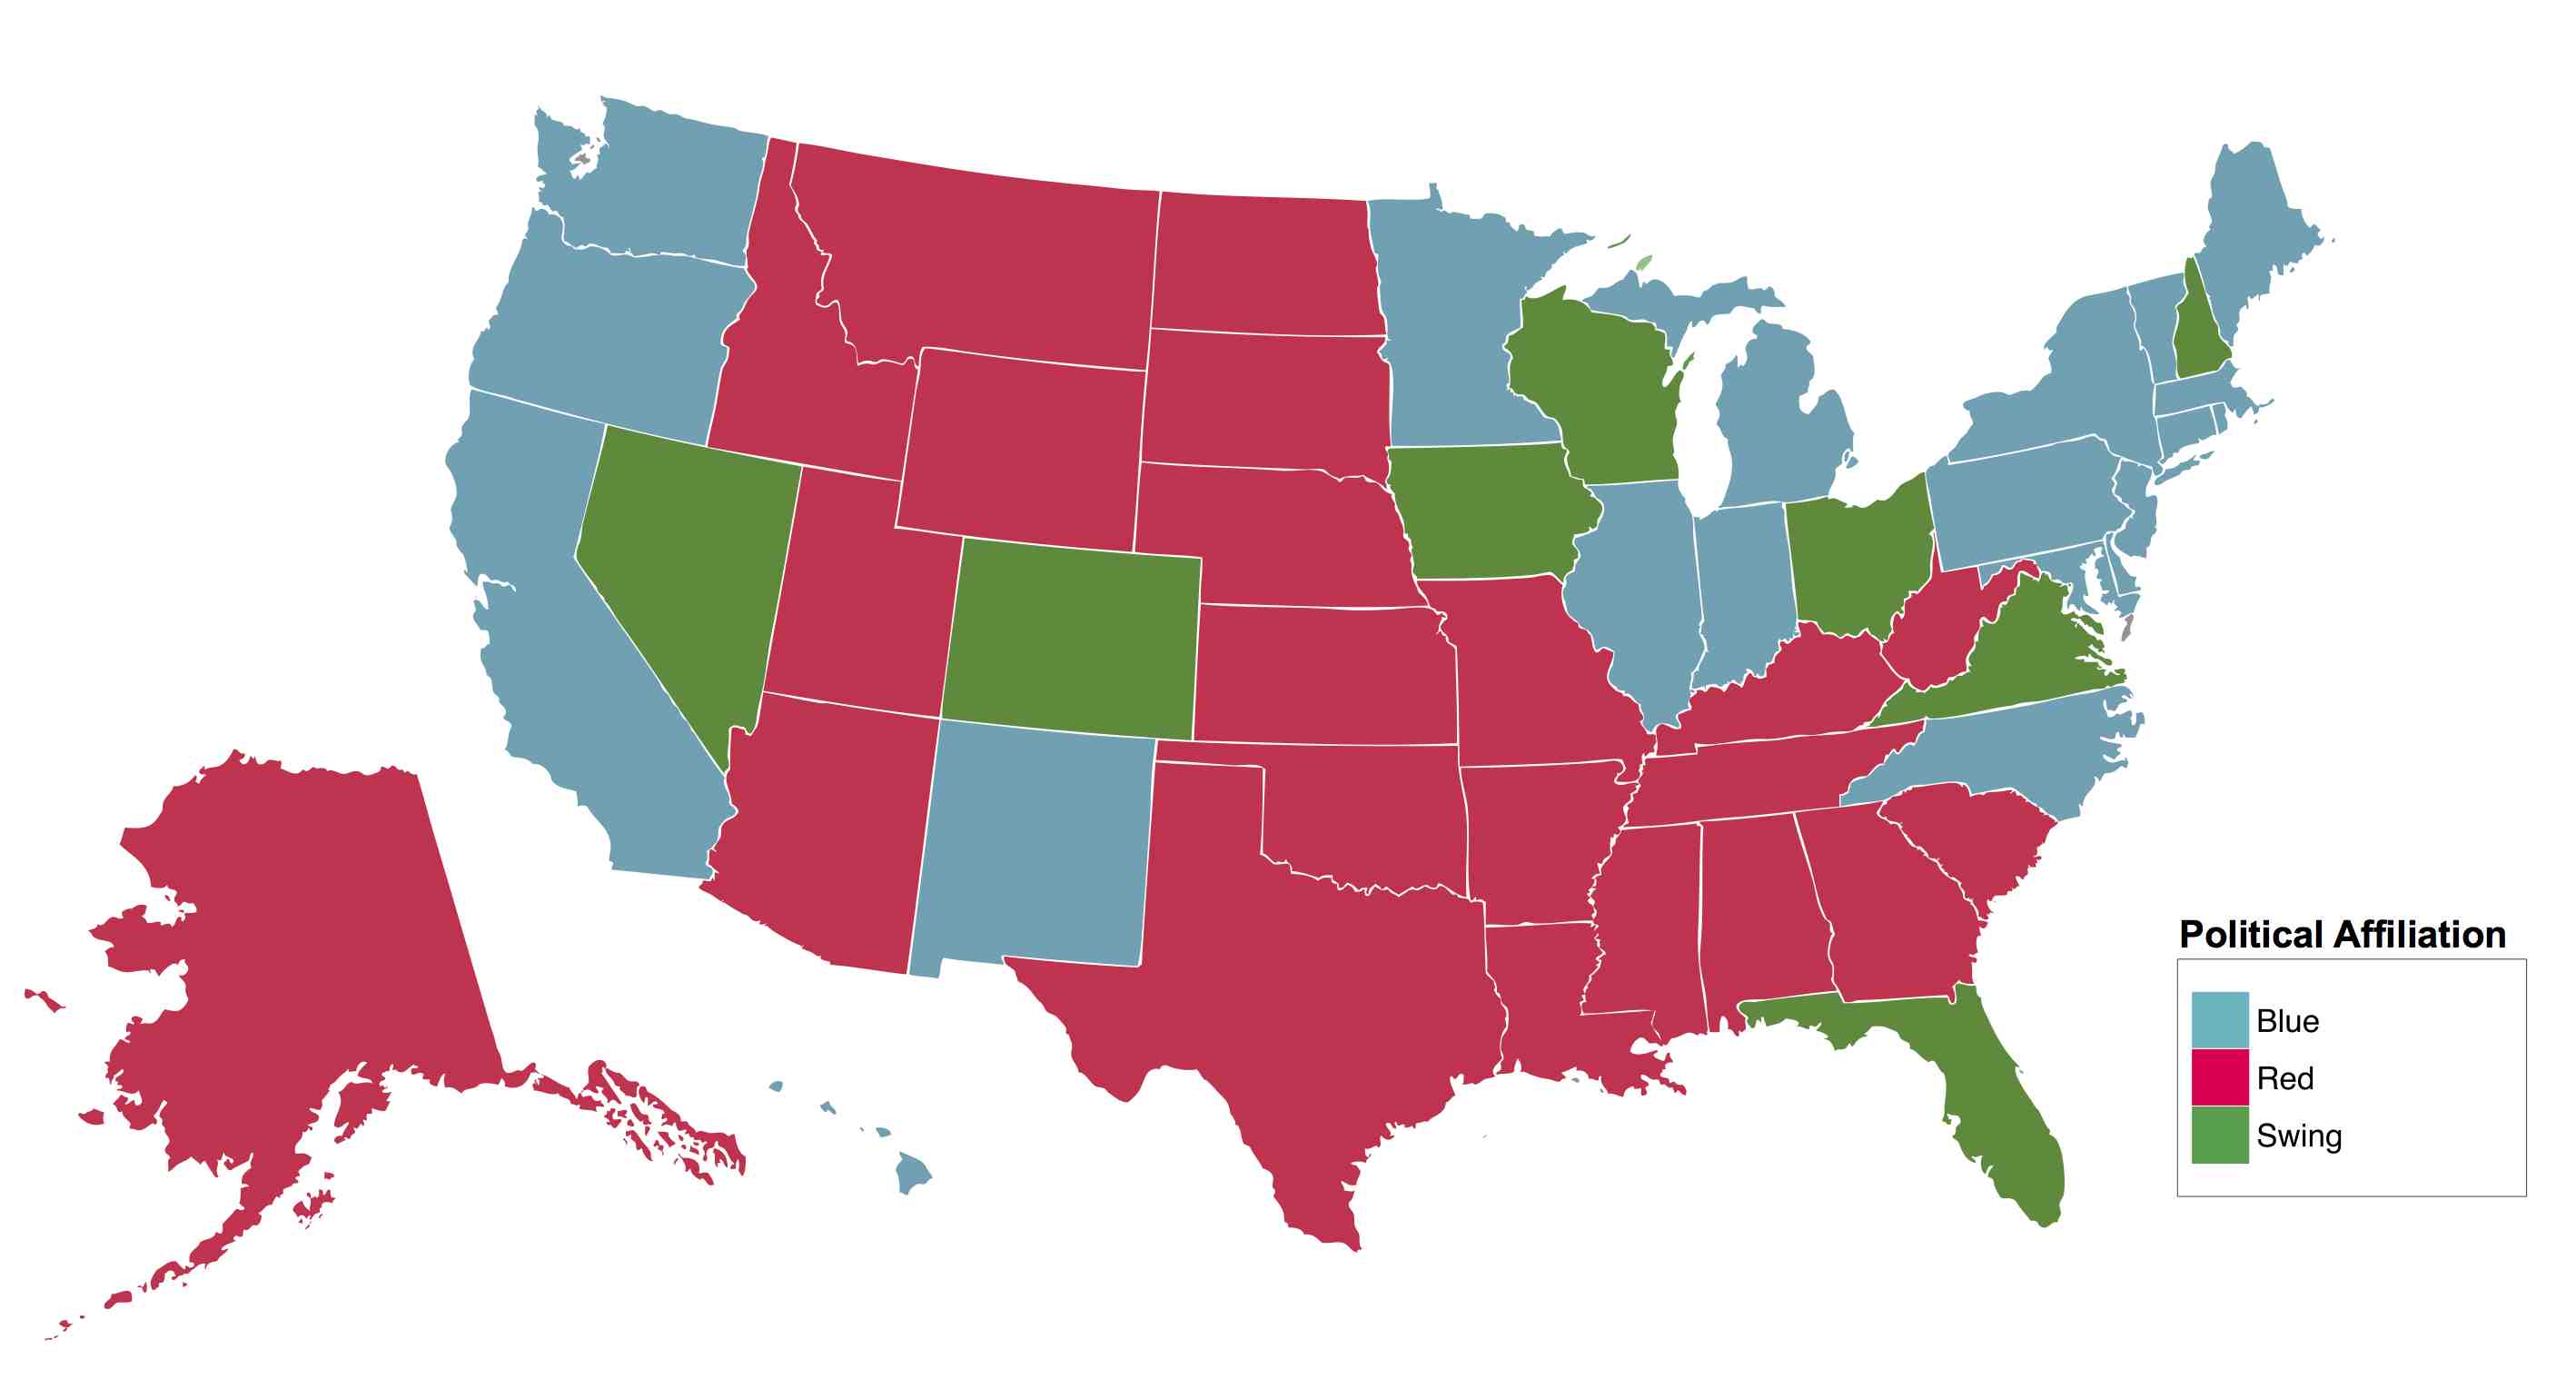
This is a map of a divided United States.
Every four years, the country is split into Red States and Blue States, and a small handful of states become political battlegrounds collectively known as Swing States. Here at Indiegogo, we wanted to investigate these political divides in the context of crowdfunding. Specifically, what similarities and differences are there in campaign and contribution behavior across red, blue, and swing states? Using information collected from our users, combined with publicly available data, we discovered the following trends:
Where Does the Money Come From?
The first thing we wanted to know was which states were raising the most money on Indiegogo. We constructed an index based on a simple linear mapping of dollars contributed per capita. We then used Obama’s margin of victory (percentage points) in the 2008 presidential election as a proxy for the relative “blueness” or “redness” of any given state. By this measure, Hawaii is the bluest state, while Wyoming is the reddest.
We found that states traditionally voting Democratic tend to raise more money per capita than those traditionally voting Republican. Note that South Dakota is a clear outlier and not shown, though it is reflected in the regression line.
While the above graph is interesting, we dug a little deeper and looked at the data broken down by type of campaign:
It turns out that while Blue States still raise more money than Red States across the board, the type of campaign does factor into where their money is going. The per capita disparity is greatest for creative campaigns, less so for cause-related campaigns, and smallest for entrepreneurial campaigns.
Where Does the Money Go To?
We then looked at the flow of funds into and out of our three categories of states. Hereafter we have controlled for distance, family, and friend effects by removing intrastate contributions from our dataset.
Though Blue States raise more money per capita, they also tend to mooch a bit more. When we considered the sheer proportion of money raised and contributed, both Red and Swing States are net donors, meaning they bring in less money than they give out. Blue States, on the other hand, are net receivers of money.
However, looking at average contribution amounts tells a somewhat different story.
The data shows that Blue States contribute indiscriminately — in fact they give $1 more per contribution to Red and Swing states than to fellow Blue States. Red and Swing States, by contrast, give about equal amounts per contribution to other Red and Swing States — but $10 less per contribution to Blue States.
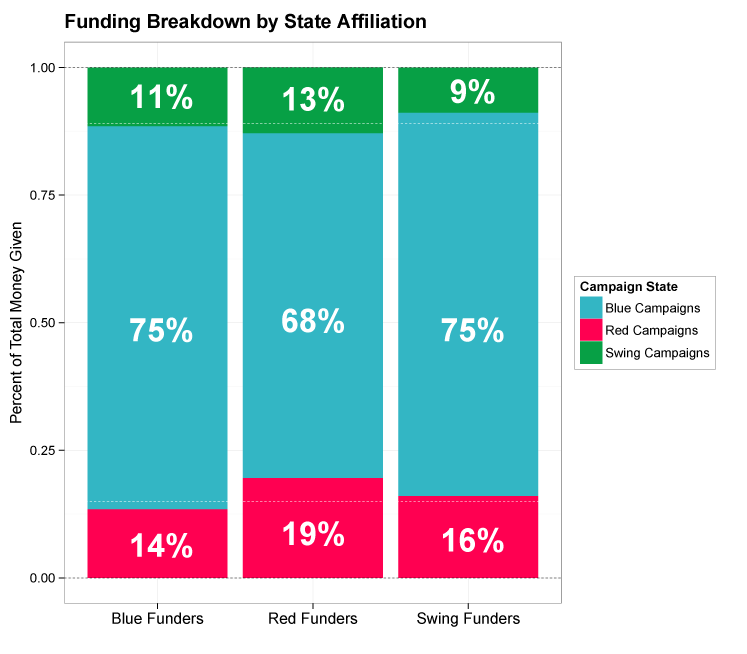
But what about total contribution amounts between states? If people contributed indiscriminately across the political spectrum regardless of their own states’ political affiliations, then we should expect the distribution of funds to be in roughly the same proportions as the site-wide breakdown.
After running a chi-squared test, we found that the none of the three types of states have statistically significant deviations from the theoretical proportions, as indicated by the dotted lines. This shows that there is no contribution bias toward any particular group.
Charitable Motivations
We defined “altruistic” money as dollars contributed that were not associated with a perk or that exceeded the value of the perk claimed. In other words, altruistic money is money that receives no compensation.
As you can see, there is a slight negative correlation between a state’s political affiliation and the percent of dollars given that are given without anything in return: Red States, on average, are a little bit more altruistic than Blue States.
Political Contributions and Crowdfunding
Finally, we tied Indiegogo state contribution data to publicly available data on political donations by party. We plotted percent of total political donations that went to Democrats against percent of total dollars contributed to Indiegogo campaigns in Blue States.
Aside from a couple of outliers, interstate contributions on Indiegogo generally mirror interstate political contributions. States with a large percentage of political money given to blue states tend also to have a greater percentage of Indiegogo contributions given to blue states — and vice versa. For example, Vermont gave over 80 percent of its political donations to the Democratic party and also contributed more than 80 percent of its money to other Blue States on Indiegogo.
Notes:
1. All campaign and contribution data was gleaned from Indiegogo. Intrastate contributions were removed to control for in-state/family/friend bias.
2. 2008 elections data was taken from the FEC Official Report.
3. The New York Times 2012 electoral map was used to determine swing states. Of the remaining states, those won by Obama in 2008 were labeled “blue”; states won by McCain in 2008 were labeled “red”.
4. External Political Contributions by Party Lines were sourced from the FEC and are accurate as of Oct 1, 2012. Totals include PAC and individual contributions to federal candidates and parties.


You must be logged in to post a comment.